djigger
Are you struggling to monitor your Java apps and diagnose performance problems?
What is djigger?
djigger is an open source performance monitoring and profiling solution for Java. It is suited for 24/7 monitoring in production and offers a wide range of features such as bi-directional thread/package filters, advanced multi-level node filters and a number of views for spotting different patterns and answering different questions. Cross-JVM drill-downs and business data harvest are also possible in agent mode via subscriptions (instrumentation).
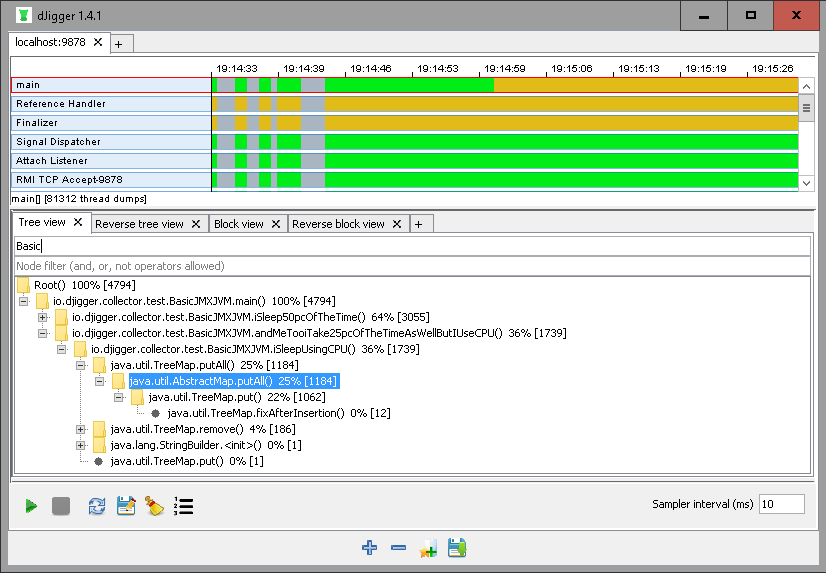
A powerful profiler for identifying hotspots
djigger is built on a mixture of stack trace sampling and instrumentation capabilities for data gathering. The combination of aggregated stacktraces and thread timelines allow you to identify hotspots in an application or in a transaction within a few seconds and get a clear picture of where and how the precious response time is lost.
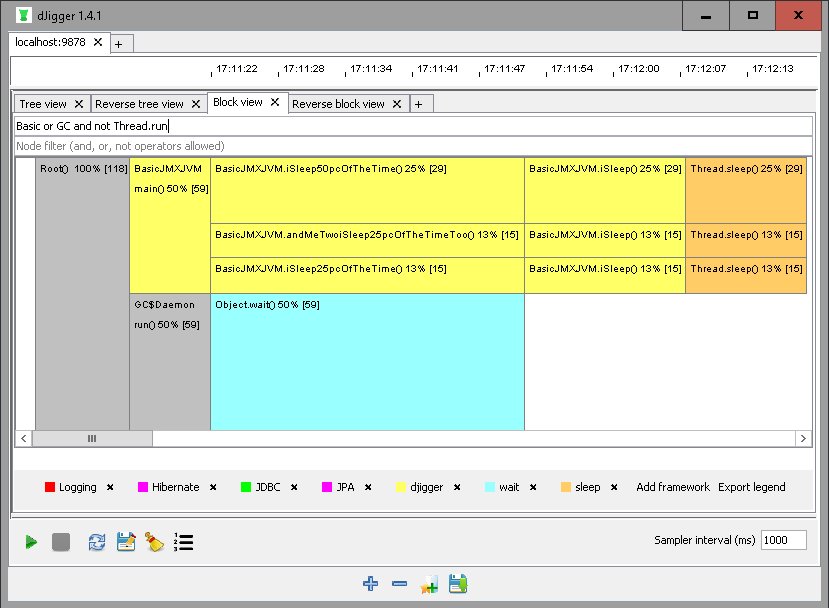
Intuitive analytical fonctionality
Many additional filtering, aggregation and visualization features such as reverse tree views, proportional block views and autocoloring we built into djigger will make your analysis workflow very intuitive and will reduce your Time To Resolution.
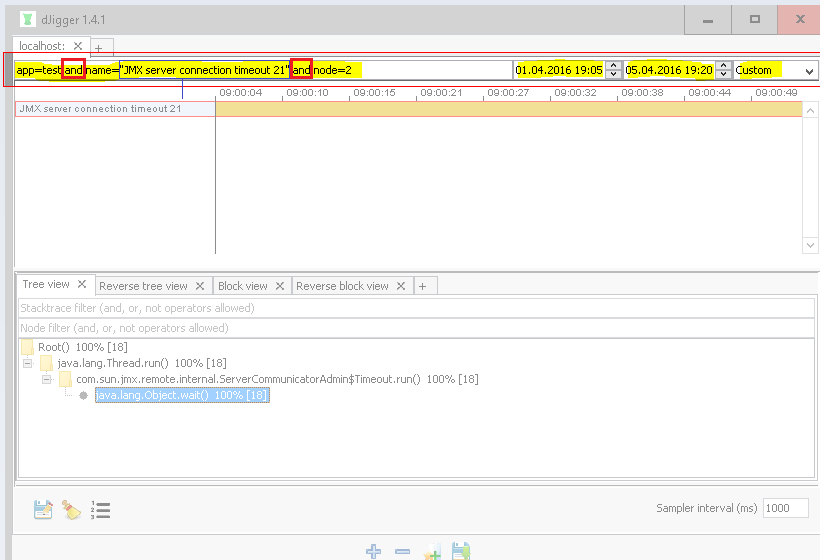
A Store mode for 24/7 Production Monitoring
A scalable collector enables round-the-clock monitoring in production as well as test environments. All you have to do is add a list of target JMX connections to our config file and flag them with custom attributes. You can query the stacktraces of the different environments and applications against the mongoDB Store very quickly and efficiently via a powerful antlr-based query engine and mongo's secondary indexes on the custom attributes.
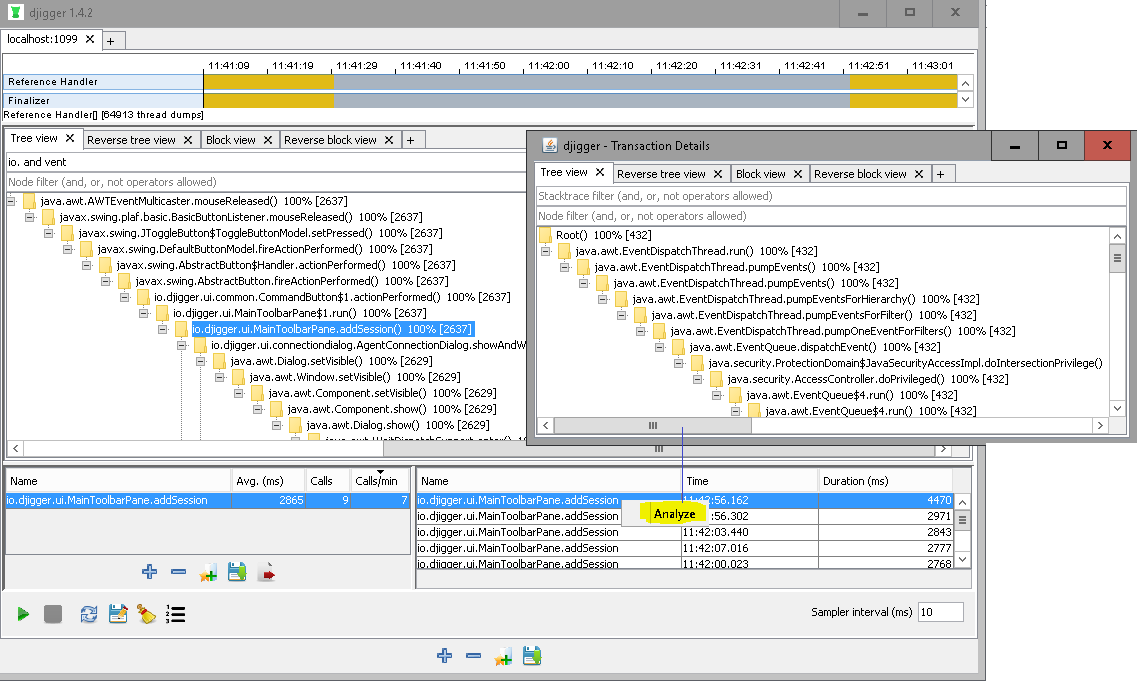
An agent mode for deep-dive analysis
We also built an agent that can instrument code and measure absolute performance values in your Java applications. You can filter and analyze individual transactions by instrumenting entry-point methods on the fly. Distributed tracing and Object Peeking are already available as of v1.5.1 and more views are currently being implemented.
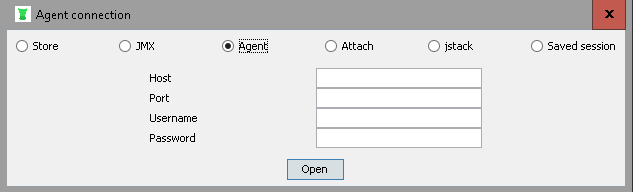
Large JVM Vendor support and a wide array of connectors
In addition to the stacktrace Store, JMX and Agent connectivity, we support Process Attach, File parsing (output of kill -3 events / jstack), and User Saved Sessions. Since we rely on Java Spec fundamentals, we're virtually compatible with any JVM vendor. That said, most of our tests have focused on the Oracle / Sun and IBM JVMs.
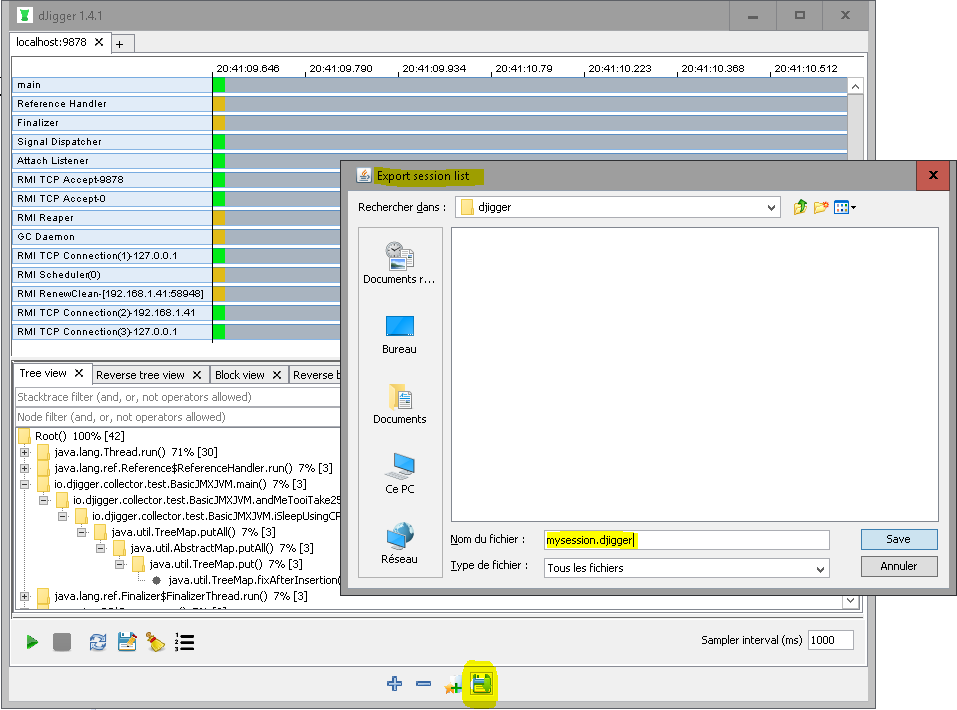
Exports & Collaboration
Due to the centralized nature of our Persistence Store, many colleagues or teammates can work collaboratively on analyzing an issue. In addition, we support session exports which allow our users to save and restore the state of his GUI and therefore interact and collaborate efficiently in the problem solving workflow.